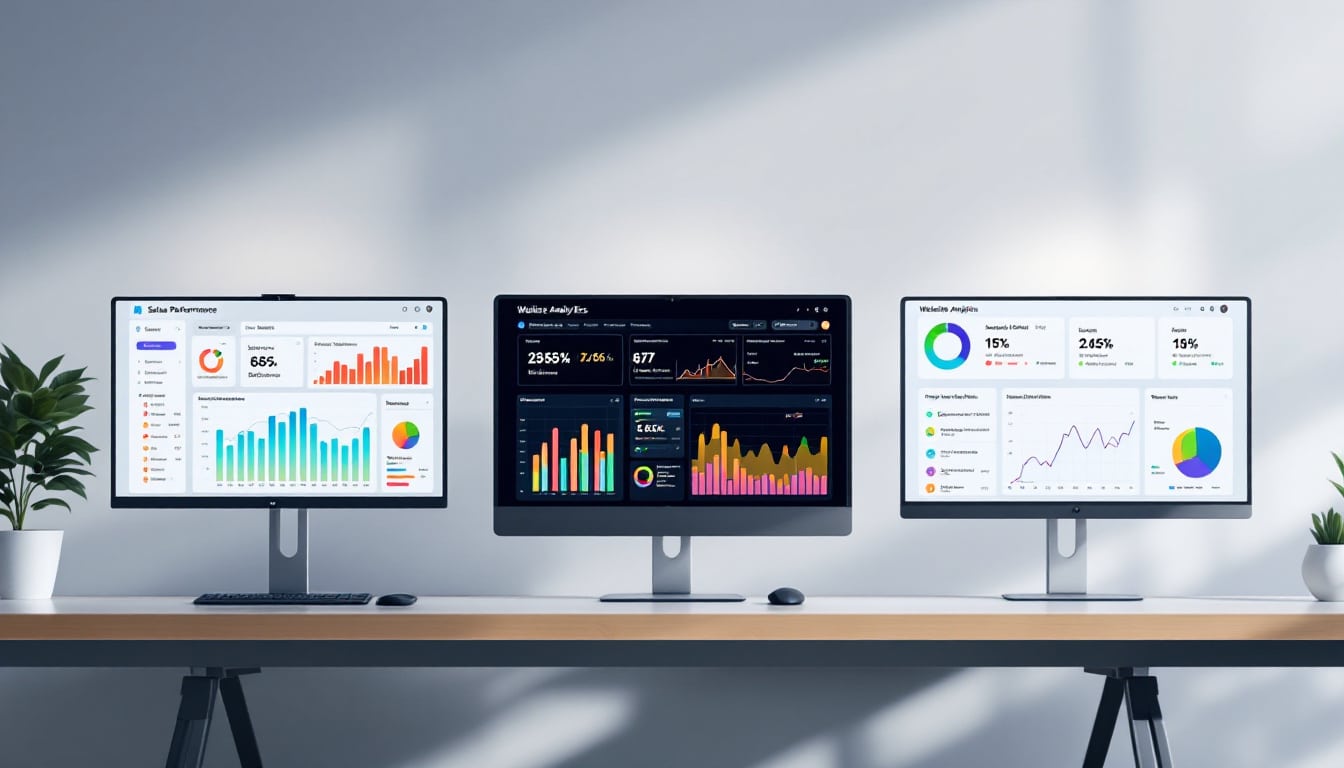
A project is a bit like a car in full motion. Without a dashboard, it’s hard to track its speed, fuel, or other essential data. Similarly, a project without a dashboard lacks visibility and control.
To bring your initiatives to life, it is crucial to have a visual tool that synthesizes key information. Dashboards provide a real-time overview of performance, deadlines, and resources. They enable teams to make informed decisions and stay aligned with objectives. By exploring different examples of dashboards, you will discover how to optimize project management for assured success.
🔥 Nous recommandons Ideamap
Ideamap est l’outil idéal pour un brainstorming ou un projet collaboratif. Grâce son interface facile et à ses fonctions IA, Ideamap booste votre créativité tout en favorisant une meilleure organisation de vos idées pour atteindre vos objectifs.
Hello, my name is Héloïse, I am 33 years old, and I am a writer. Passionate about words and creativity, I put my expertise at the service of your projects to bring them to life through engaging and tailored content.
Defining a Dashboard
A dashboard in project management is a visual tool that provides a real-time overview of key data, metrics, and performance indicators of a project. Comparable to a control panel in a car, it gathers essential information on progress, timelines, budget, risks, and resources within a single, easy-to-read interface.
The primary objective of a dashboard is to help project managers, teams, and stakeholders quickly assess the health and status of a project, thus facilitating informed decisions without having to sift through lengthy reports. By incorporating real-time data, dashboards replace traditional manual reporting methods, thereby improving decision-making, communication, and overall efficiency.
To learn more about the impact of dashboards on innovation, check out this article on measuring the impact of dashboards on innovation.
The Essential Elements of a Dashboard
A well-designed dashboard should provide a clear and real-time snapshot of the performance and progress of a project. To be truly effective, it must include the most relevant and actionable data, presented in an intuitive manner. Here are the key components that any dashboard should include:
Key Performance Indicators (KPI)
KPIs are fundamental metrics that show the project’s performance against its objectives. Commonly used KPIs include task completion rates, actual budget versus planned budget, adherence to schedule, resource utilization, and risk status.
Data Visualization
Charts facilitate understanding of complex data. Dashboards should include bar and pie charts for task status or resource allocation, Gantt charts for project timelines, and burn-down charts for tracking remaining work in agile projects.
Comparisons and Trends
It is crucial not only to see current data but also to understand its evolution over time. Dashboards should show comparisons between planned and actual data, performance over multiple weeks or sprints, and historical trends regarding risks or workload.
Filters and Drill-Down Features
A dashboard becomes even more powerful when users can customize their view. Filters allow sorting data by team member, department, task type, or period. Drill-down features enable deeper exploration of specific metrics by clicking on them.
5 Examples of Dashboards
Now that we understand what a dashboard is and its components, let’s explore five common examples of dashboards, defining each of them and listing the metrics they typically monitor.
Project Dashboard
A project dashboard is a centralized tool that provides a real-time visual overview of the progress, performance, and key metrics of a project. It helps project managers, teams, and stakeholders monitor tasks, budgets, resources, and potential risks all in one place. By consolidating essential data, this type of dashboard enhances decision-making, accountability, and efficiency throughout the project lifecycle.
Key components include:
- Project Timeline (Gantt Chart or Milestones): Displays the project calendar, critical deadlines, and key milestones.
- Task Progress: Tracks the status of tasks to show what is completed, in progress, or overdue.
- Budget vs. Actual Costs: Compares planned costs with actual expenditures to prevent budget overruns.
- Resource Allocation: Shows how team members and resources are distributed across tasks.
- Risk and Issue Tracking: Identifies potential risks, bottlenecks, and unresolved issues.
- Key Deliverables and Deadlines: Highlights the main deliverables of the project and their due dates.
- Status by Phase or Team: Breaks down progress by phase or department for better tracking.
Enterprise KPI Dashboard
The enterprise KPI dashboard is a data-driven tool that provides a real-time overview of an organization’s performance based on KPIs. It helps leaders and teams monitor progress towards financial, operational, and strategic goals. By visualizing essential metrics in one place, this dashboard facilitates informed decision-making, efficiency improvements, and growth tracking.
Key metrics include:
- Revenue Growth and Profit Margins: Tracks sales performance and overall profitability.
- Customer Acquisition and Retention: Measures the effectiveness of the business in attracting and retaining customers.
- Operating Expenses: Monitors costs related to running the business.
- Net Promoter Score (NPS): Evaluates customer satisfaction and loyalty.
- Return on Investment (ROI): Assesses the profitability of investments and business initiatives.
- Employee Productivity Metrics: Evaluates the effectiveness and performance of the workforce.
- Strategic Goals Tracking: Aligns business operations with long-term objectives.
To learn more about the essential features of dashboards, check out this guide on Monday.com dashboards.
Marketing Dashboard
The marketing dashboard is a centralized tool that provides a real-time view of marketing performance across various channels. It helps marketing teams track key metrics, analyze campaign effectiveness, and optimize strategies to maximize ROI. By visualizing data from multiple sources, this dashboard enables data-driven decision-making, better targeting, and more effective budget allocation for marketing.
Key metrics include:
- Website Traffic and Bounce Rate: Measures the number of visitors and those who leave without engagement.
- Conversion Rate by Channel: Tracks the percentage of visitors who take desired actions (sign-ups, purchases) across different marketing channels.
- Cost per Lead (CPL) and Customer Acquisition Cost (CAC): Calculates how much is spent to acquire a lead or customer.
- Email Campaign Metrics (open rates, click rates): Analyzes engagement and effectiveness of emails.
- Social Media Engagement: Measures interactions such as likes, shares, and comments on social platforms.
- SEO Keyword Ranking: Tracks the website’s positioning for targeted search terms.
- Lead Funnel Performance: Evaluates how leads progress through the sales pipeline, from awareness to conversion.
Discover an example of a marketing dashboard at this link.
Sales Dashboard
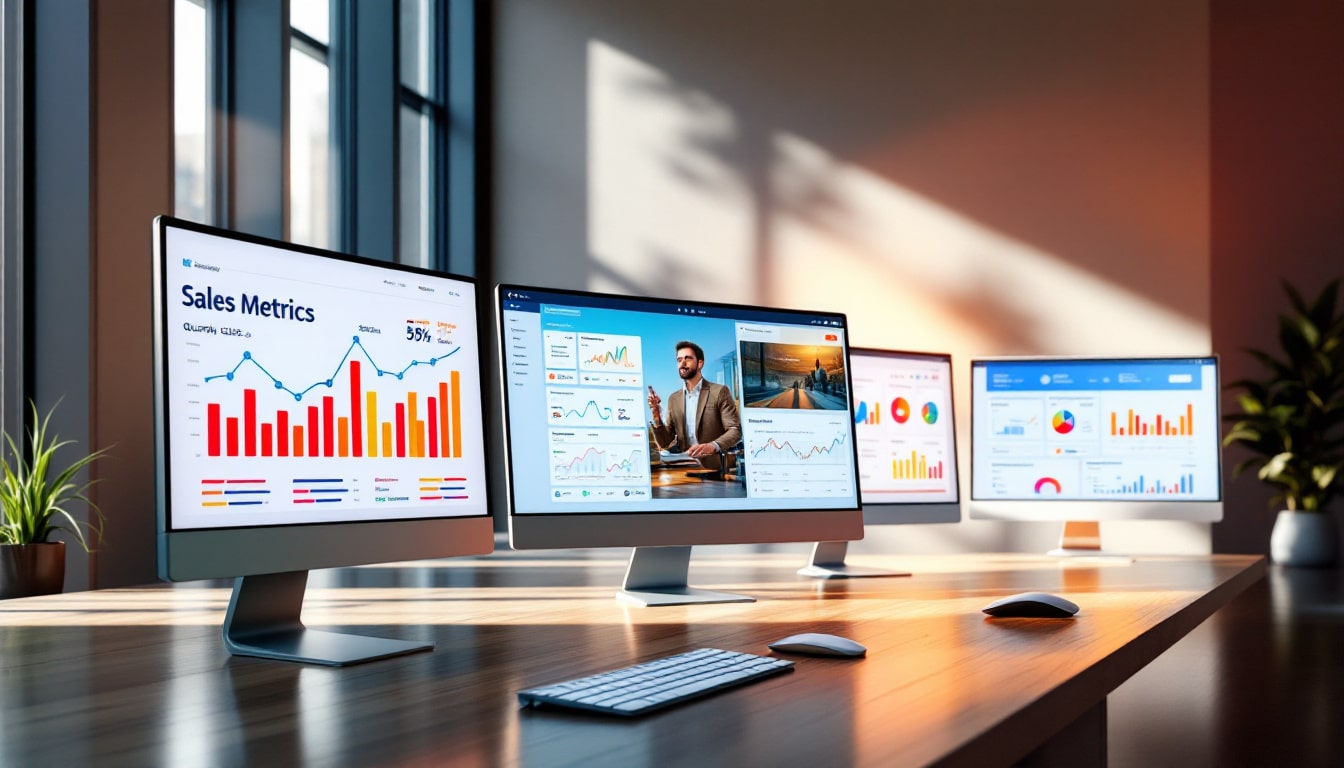
The sales dashboard is a real-time visual tool that tracks and displays key sales metrics, helping teams monitor performance, identify trends, and optimize the sales process. It provides sales managers, representatives, and stakeholders with a clear view of goal achievement and areas needing improvement. A well-designed dashboard enables data-driven decisions, better forecasting, and revenue growth.
Essential elements include:
- Monthly and Quarterly Sales Revenue: Total revenue generated over a specific period.
- Sales Pipeline and Opportunity Stages: Tracks offers as they progress through each phase of the sales cycle.
- Lead to Customer Conversion Rate: Measures the percentage of leads that actually become customers.
- Top Sales Performers: Highlights team members with the best results or the most signed contracts.
- Deal Success Rate: Total percentage of closed deals successfully.
- Average Deal Size: Average revenue generated by each closed deal.
- Sales Forecast vs. Reality: Compares projected sales with actual results to gauge forecasting accuracy.
For an example of a sales dashboard, visit this link.
Operational Management Dashboard
The operational management dashboard is a powerful tool that provides a real-time view of key operations within an organization. It consolidates metrics related to production, logistics, workforce performance, and customer service into a single centralized dashboard. This type of dashboard helps operations managers monitor efficiency, reduce bottlenecks, maintain quality standards, and ensure smooth daily operations across various departments.
Key components include:
- Production Volume and Efficiency: Tracks production levels and the efficiency of resource utilization during production.
- Supply Chain and Inventory Levels: Monitors stock availability and supply chain performance to prevent shortages or overstocking.
- Order Processing Time: Measures the speed and accuracy with which customer orders are processed and delivered.
- Downtime and Maintenance: Captures machine or system downtimes and scheduled maintenance to prevent interruptions.
- Quality Control (Defect Rates): Tracks defects or errors in products to ensure compliance with quality standards.
- Workforce Utilization: Shows the effectiveness of time and skill utilization of employees in operations.
- Customer Support Response Time: Measures how quickly support teams respond to customer requests or issues.
Explore an example of an operational management dashboard at this link.
The Benefits of Dashboards in Project and Business Management
Dashboards are crucial tools for effective project and business management. They provide a centralized view of critical data, allowing project managers and business leaders to monitor performance, track progress, and make informed decisions with ease. By consolidating key metrics such as schedules, budgets, resources, and KPIs into a single visual platform, dashboards eliminate the need to sift through multiple spreadsheets or reports.
This simplified access to information not only saves time but also improves visibility, allowing teams to stay aligned and proactive throughout the project lifecycle or business operations. Furthermore, dashboards can identify trends, spot risks early, and track objectives in real time. Through dynamic graphs, progress bars, and comparison tools, users can quickly detect discrepancies between planned and actual performance.
For example, spotting a cost overrun, recognizing a delay in task completion, or observing a decline in customer engagement are valuable insights that dashboards provide in a timely manner, helping to mitigate issues before they escalate. This responsiveness is essential for maintaining control and achieving successful outcomes.
Moreover, dashboards promote transparency and accountability within teams and among stakeholders. By making project and operational performance visible, they encourage collaboration, foster shared responsibility, and support data-driven conversations. When every team member can see how their work contributes to the whole, engagement and motivation improve. Meanwhile, stakeholders gain confidence in the process, knowing they have a clear and real-time understanding of progress, risks, and outcomes.
To discover more about project management and dashboards, read this article on creating a project activity schedule.
Free Dashboard Templates
Here are three free dashboard templates you can use to apply the features presented in our examples:
Enterprise KPI Dashboard
Download this free KPI dashboard for Excel to provide an overview of your company’s performance across various departments. The goal is to help leaders and teams monitor progress, identify trends, and make decisions aligned with strategic objectives.
Project Dashboard Template
Use this project dashboard template for Excel to visually track and manage key aspects of a project in a centralized view. It helps project managers and teams to monitor progress, performance, and potential risks by displaying important metrics.
Budget Dashboard Template
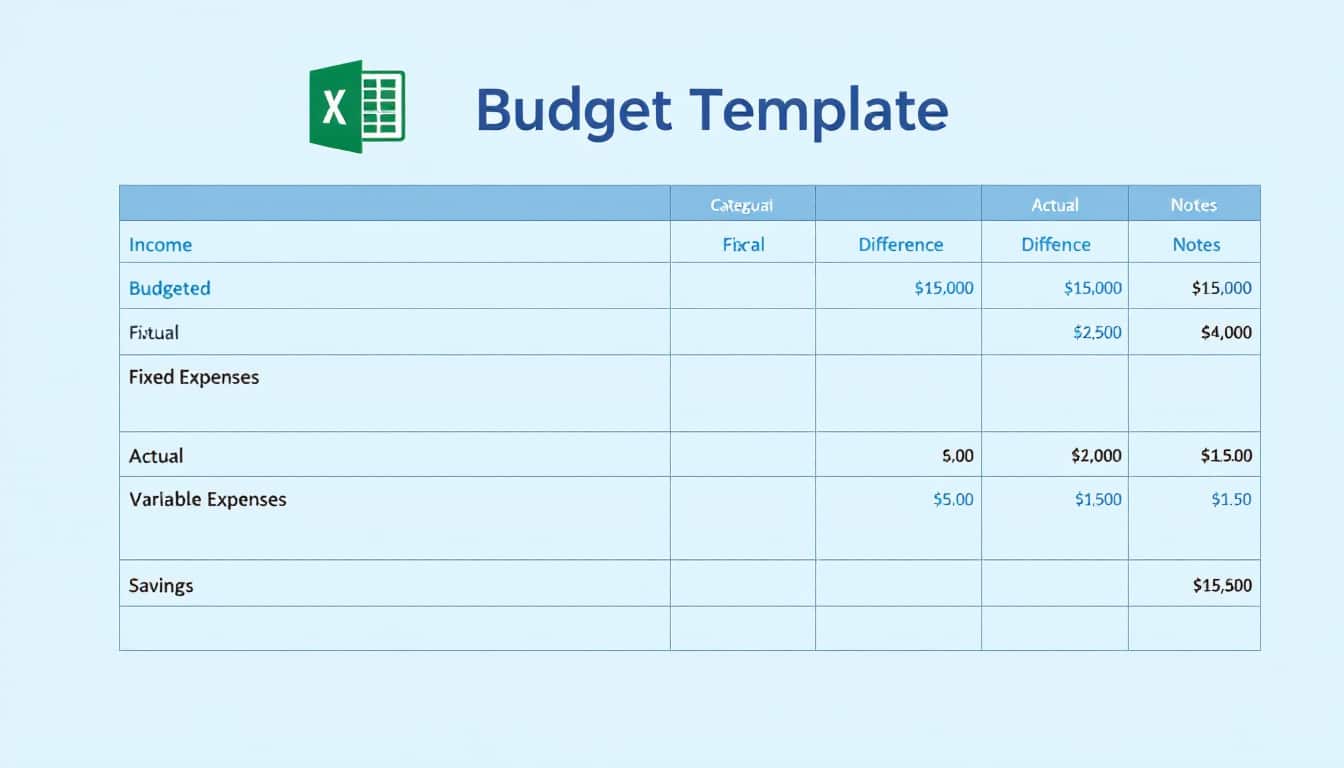
A budget dashboard is a visual tool designed to help individuals or organizations track revenues, expenses, and overall financial performance against a budget. This free Excel template provides an overview of financial health by consolidating key budget data into interactive charts, graphs, and summaries—all in one place.
To access more free project management templates, visit our site where you can download more free dashboards.
ProjectManager: The Ideal Dashboard Tool for Project Management
Using a template like a dashboard can be frustrating. Templates are static documents requiring manual entry of project data. Thus, you don’t observe real-time data but always look in the rearview mirror. That’s why you need to choose online project management software to get the most accurate and current information about the project.
ProjectManager is an award-winning project and portfolio management software that provides real-time dashboards for one or multiple projects without requiring prior setup. Use the dashboard alongside our other project views, including reports, Gantt charts, lists, sheets, and calendars to keep your projects on track.
- Track unique data on customized dashboards at both the project and portfolio level.
- Transform dashboard data into customized reports in just a few clicks.
- Use free guest licenses to share relevant data with stakeholders. Try it for free.
ProjectManager dashboards provide real-time data with no configuration needed. To learn more, visit our site.
Using multiple project management views maximizes efficiency:
- Gantt charts to schedule tasks, resources, and costs.
- Kanban boards or task lists to log status updates that feed automatically into the dashboard.
- Calendar view for a monthly overview that stakeholders can use to stay informed.
Robust resource management and cost tracking features allow you to:
- Observe resource allocation across one or more projects via color-coded workload charts.
- See who is overloaded or underutilized and balance workloads without leaving the page.
- Customize reports to focus on key data points or more generalized information to share with stakeholders.
- Track labor costs with secure timesheets to help keep projects on budget.
To learn more, check out this article.
Related Content on Dashboards
For those looking to delve deeper into how dashboards help manage projects, here are a few free links to recently published articles on our blog:
- Design Thinking: how to measure its impact on innovation
- Monday.com dashboard: essential features, advantages, and disadvantages
- How to develop a project activity schedule
- Asana dashboard: essential features, advantages, and disadvantages
- The essential checklist for launching your project
ProjectManager is an online project and portfolio management software that connects teams, whether in the office or in the field. They can share files, comment at the task level, and stay informed through email notifications and in-app alerts. Join teams at Avis, Nestlé, and Siemens who use our software to successfully complete their projects. Start with ProjectManager for free today.


