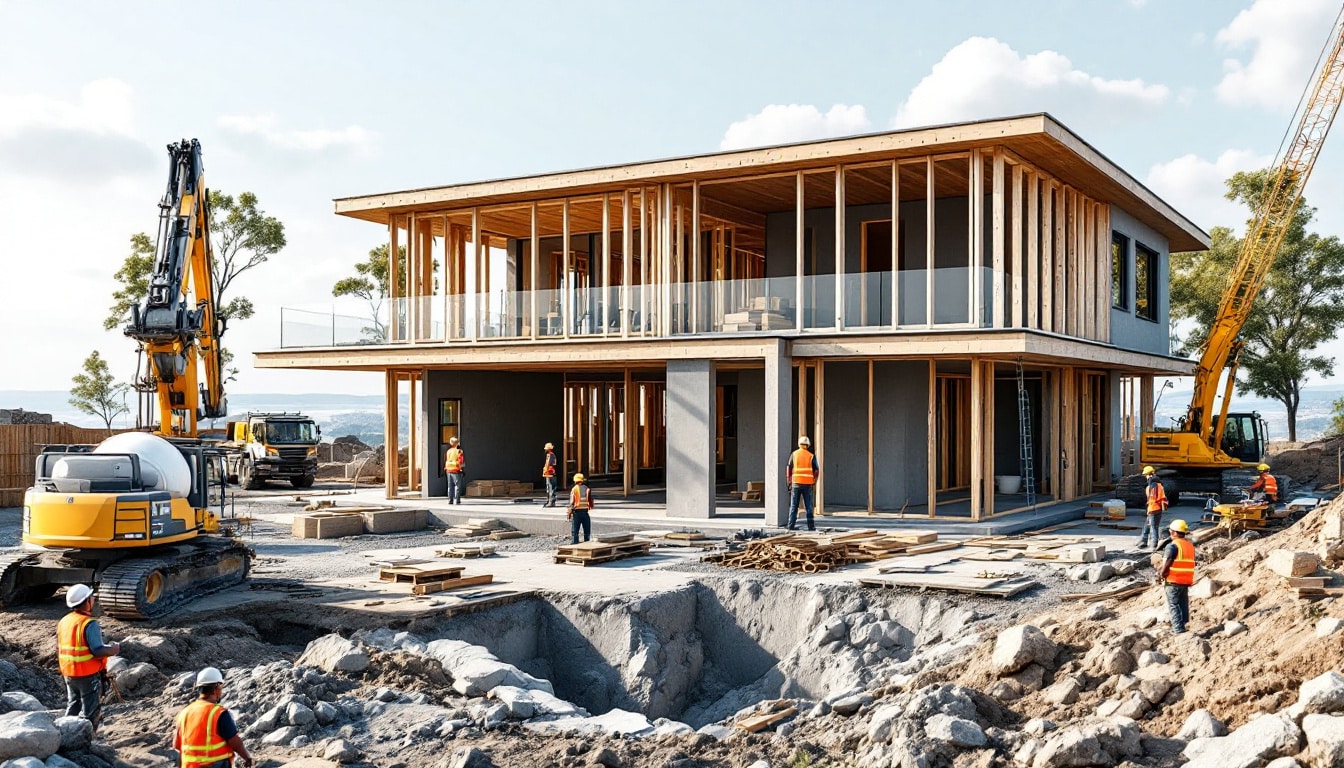
Project management becomes a true art when one has the appropriate tools. Project management graphs are indispensable allies that facilitate the visualization of tasks, goals, and workflows. Thanks to their ability to transform complex information into simple and clear representations, these tools are essential for optimizing every step of planning. Let’s discover together the 17 best graphs that can enrich your approach to project management and help you stay on track with your goals.
🔥 Nous recommandons Ideamap
Ideamap est l’outil idéal pour un brainstorming ou un projet collaboratif. Grâce son interface facile et à ses fonctions IA, Ideamap booste votre créativité tout en favorisant une meilleure organisation de vos idées pour atteindre vos objectifs.

When it comes to project management, using suitable graphs is an asset for optimizing each phase of the process. Diagrams provide a visual representation that helps teams understand and track the progress of tasks, deadlines, and resources. Among the options, the Gantt chart is particularly appreciated for its ability to represent the project timeline clearly, thus facilitating planning and tracking of progress.
impact of graphs on project planning
Graphs of management enhance communication within teams by translating complex data into simple and understandable visuals. A PERT chart is an excellent example, as it allows identifying dependencies between tasks, ensuring that nothing is left to chance. Moreover, these visualization tools promote smooth collaboration by enabling real-time updates of progress, which is essential for the successful delivery of any project.
choosing the right graph for your project
Every project has its own specifics, hence the need to select the most appropriate type of graph. A Kanban board, for example, is ideal for agile workflow management, while a RACI chart helps clarify the roles and responsibilities of each team member. This customization of visual tools helps maximize efficiency by addressing the specific needs of your project while fostering better organization.


