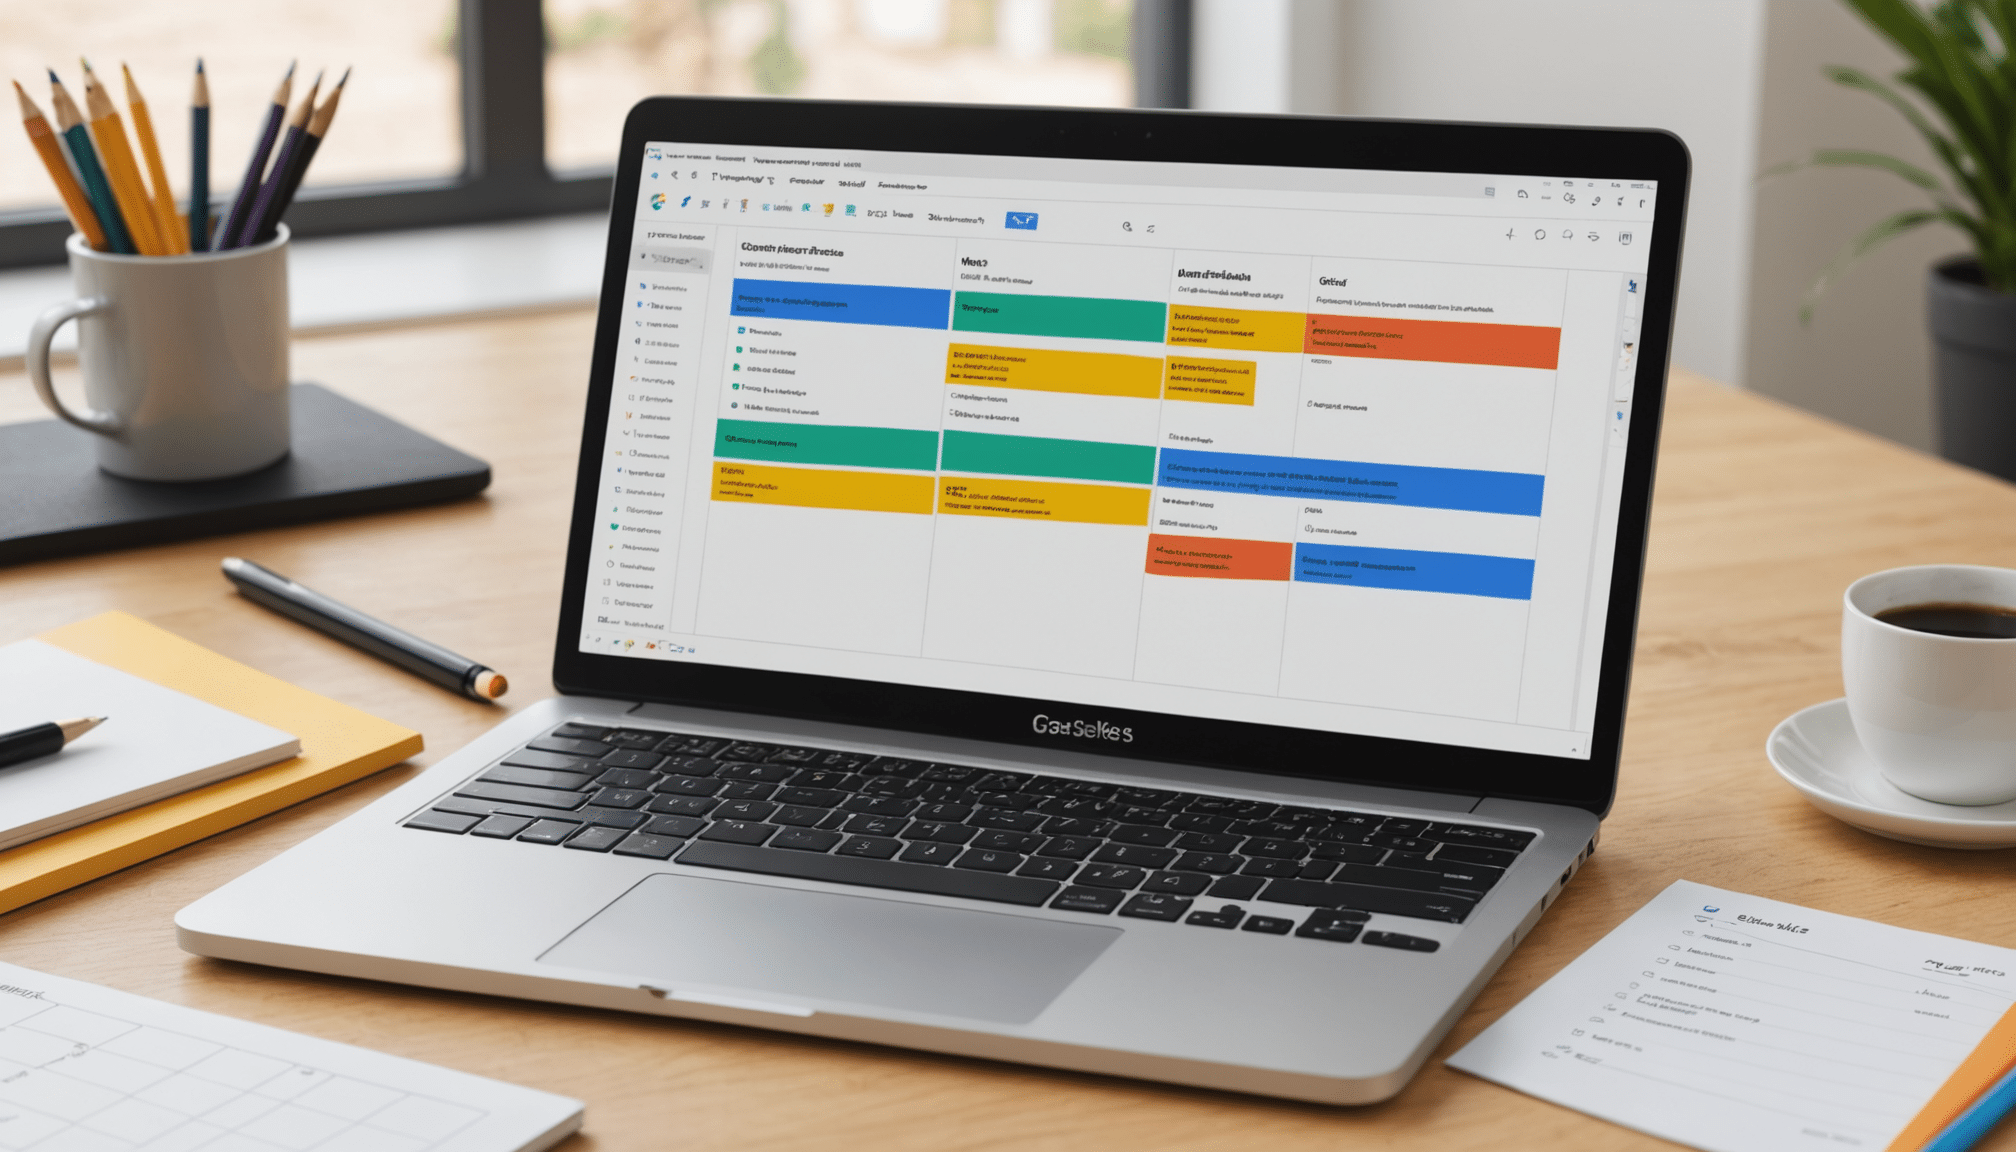
Creating a Gantt chart in Google Slides can transform the way you visualize and manage your projects. This step-by-step guide will help you learn how to easily design this valuable template while providing you with a free downloadable template to get started quickly. With this simple process, you will effectively represent your timelines and ensure clear communication with your team.
🔥 Nous recommandons Ideamap
Ideamap est l’outil idéal pour un brainstorming ou un projet collaboratif. Grâce son interface facile et à ses fonctions IA, Ideamap booste votre créativité tout en favorisant une meilleure organisation de vos idées pour atteindre vos objectifs.
Creating a Gantt chart in Google Slides is a straightforward and accessible process. This step-by-step guide will assist you in creating an effective chart for managing your projects. With a free template to download, you can quickly customize your presentation by adding tasks and setting deadlines. Thanks to the collaborative tool that Google Slides offers, easily share your chart with your colleagues and stakeholders during meetings while allowing for real-time updates. Follow the clear instructions to integrate the essential elements and clearly and concisely visualize your project timeline.

Gantt charts are an essential tool for project planning. They allow you to visualize the different tasks to be completed, along with their duration and interrelationships. This guide will help you create a Gantt chart in Google Slides by providing you with a free downloadable template and explaining each step in detail.
Why use Google Slides to create a Gantt chart?
Google Slides is accessible to everyone and perfectly suited for working in collaboration. With its features, it allows you to easily share your Gantt charts with your partners and team. Unlike other software, Google Slides offers an intuitive interface, simplifying the creation and adjustment of your project. You will thus be able to update your tasks in real-time and ensure cohesion within your group.
Steps to create a Gantt chart in Google Slides
Starting to create a Gantt chart is more than just a matter of graphic choice. Here are the steps to follow: begin by opening Google Slides and choose a template. You can choose to import your own free template or create one from scratch. Insert a table for the tasks and another for the timeline. Once that’s done, you just need to add bars representing the duration of each task. This approach will give you a clear and effective overview.


